A Snapshot of Young Children's Development in Hays County
|
Thanks to the support of local teachers, during the 2016-17 school year, parts of Hays County completed a community school readiness assessment using the Early Development Instrument (EDI). The EDI is a population measure of school readiness, it collects information about kindergarten age children in participating geographic areas and then creates an overall snapshot of their developmental progress. The EDI does not label or identify individual children with specific problems. Instead, it looks at how experiences at home and in the community can help prepare children for the school environment.
The EDI provides local leaders with the information they need to evaluate school readiness, plan how to improve programs and supports, and better coordinate services to help children develop and learn before and during their school years. The EDI provides information about children in five developmental areas that are known to affect well-being and school performance:
|
UCLA staff attended the San Marcos Commission on Children and Youth meeting on September 6, 2017 to share EDI results.
|
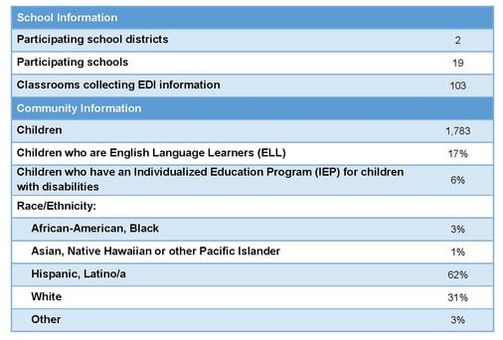 Figure 1: Children’s Background Information
Figure 1 shows that EDI data were reported for 1,783 children in Hays County. It also provides some additional background information about the children surveyed.
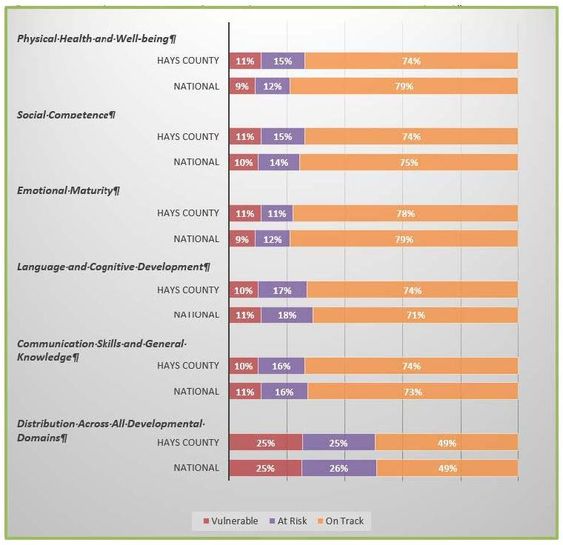 Figure 2: Summary of EDI Results by Developmental Area
Figure 2 summarizes results from the EDI. The figure describes each of the five developmental areas assessed by the EDI and, for each, displays the percentage of children who are developmentally vulnerable, at risk or on track.
- The red portion of the bar charts represents the percentage of children considered vulnerable in each of the five developmental areas. Children are categorized as “vulnerable” in a domain if the mean score of their EDI items for that domain falls at or below the 10th percentile population cutoff.
- The purple portion of the bar charts represents the percentage of children considered developmentally at risk. Children are categorized as “at-risk” in a domain if the mean of their EDI items for that domain is above the 10th percentile cutoff but falls at or below the 25th percentile cutoff.
- The orange portion of the bar charts represents percentage of children considered on track, those who fall above the 25th percentile. Children are categorized as “on track” in a domain if the mean of their EDI items for that domain falls above the 25th percentile cutoff.
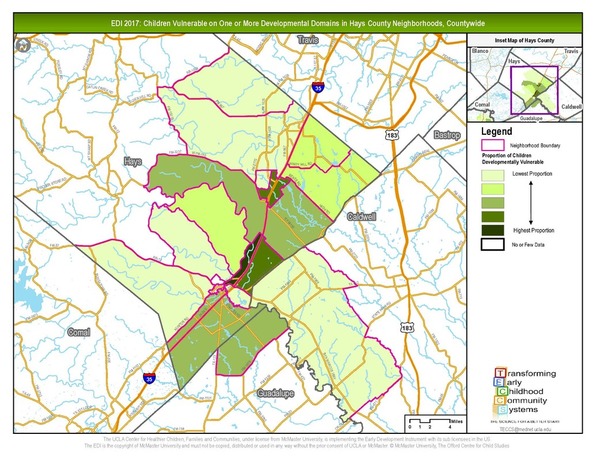 Figure 3: Map of EDI Results
Figure 3 provides a visual snapshot of children’s developmental status in different neighborhoods. The shading on the map represents the range of developmental vulnerability. Areas with lighter shading have a lower percentage of developmentally vulnerable children, while areas with darker shading have a higher percentage of developmentally vulnerable children.
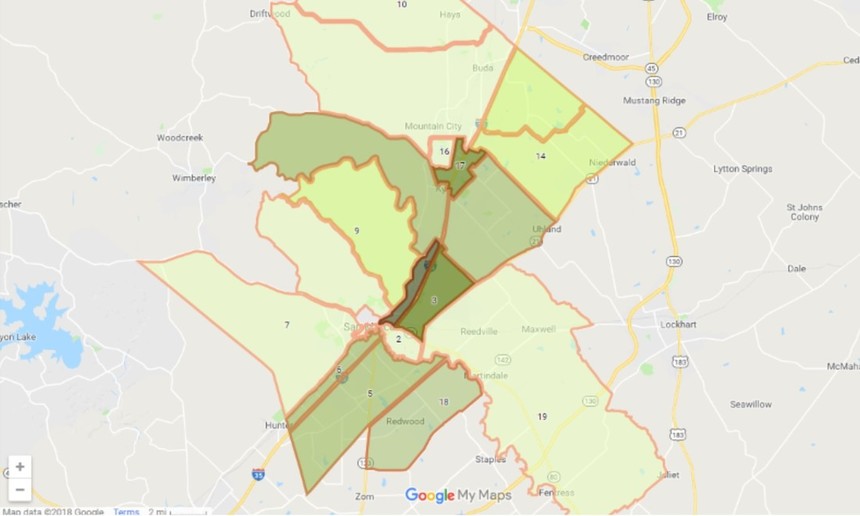
We created a Google Map to aid partners in locating the boundaries of the Census Tracts.
Additional maps, found in the slideshow below, provide a visual snapshot of children’s developmental status for each of the five developmental areas assessed by the EDI.
Indicator maps compliment the EDI maps by providing information about the influences on child development outcomes. For example, family poverty rates were mapped and can be analyzed alongside EDI results to help provide the community context for the EDI outcomes. The maps can also be used to identify service gaps by including the locations of early learning, health and family support services.
Indicator maps compliment the EDI maps by providing information about the influences on child development outcomes. For example, family poverty rates were mapped and can be analyzed alongside EDI results to help provide the community context for the EDI outcomes. The maps can also be used to identify service gaps by including the locations of early learning, health and family support services.
Community Use of the EDI to Create Positive Change for Young Children
This EDI Snapshot gives individuals, organizations and community leaders the information they need to work more effectively to improve the lives of young children. Communities are using EDI results in many creative ways, including:
- Identifying and/or increasing awareness of local needs, assets and other important indicators
- Providing baseline information on the readiness of children entering kindergarten to inform curriculum and program needs
- Improving or creating initiatives and programs
- Strengthening coordination and alignment of services
- Supporting applications for public and private funding opportunities
- Engaging communities in mapping local assets
- Building a framework for understanding child development and the importance of investing in young children
- Taking collective actions to meet the developmental needs of children
- Building networks of school readiness advocates and creating partnerships between organizations
- Improving professional development opportunities and supports for those caring for young children
- Assisting with strategic planning for organizations and community initiatives
- Learning from differences in strengths and needs between local neighborhoods
About Us
This effort to track and improve conditions for young children is led by the Start Smart Texas Hays & Caldwell. Our local effort is part of a national initiative called Transforming Early Childhood Community Systems (TECCS). TECCS is a partnership with the UCLA Center for Healthier Children, Families and Communities and United Way Worldwide. TECCS uses EDI data to improve school readiness by providing accurate information about young children's developmental progress that guides state, regional and local efforts to make effective improvements in early childhood systems. Since 2008, TECCS has spread to over forty communities nationwide.